Review Meetings Page
Agenda
- Look at MDC results for BNS (among others, we identified the root cause of why very loud injections were being missed; see below)
- Look at S6-replay test run
- Run pipeline tutorial
- Review GRACE-DB: https://ldas-jobs.cgca.uwm.edu/~gstlalcbc/online_analysis.html
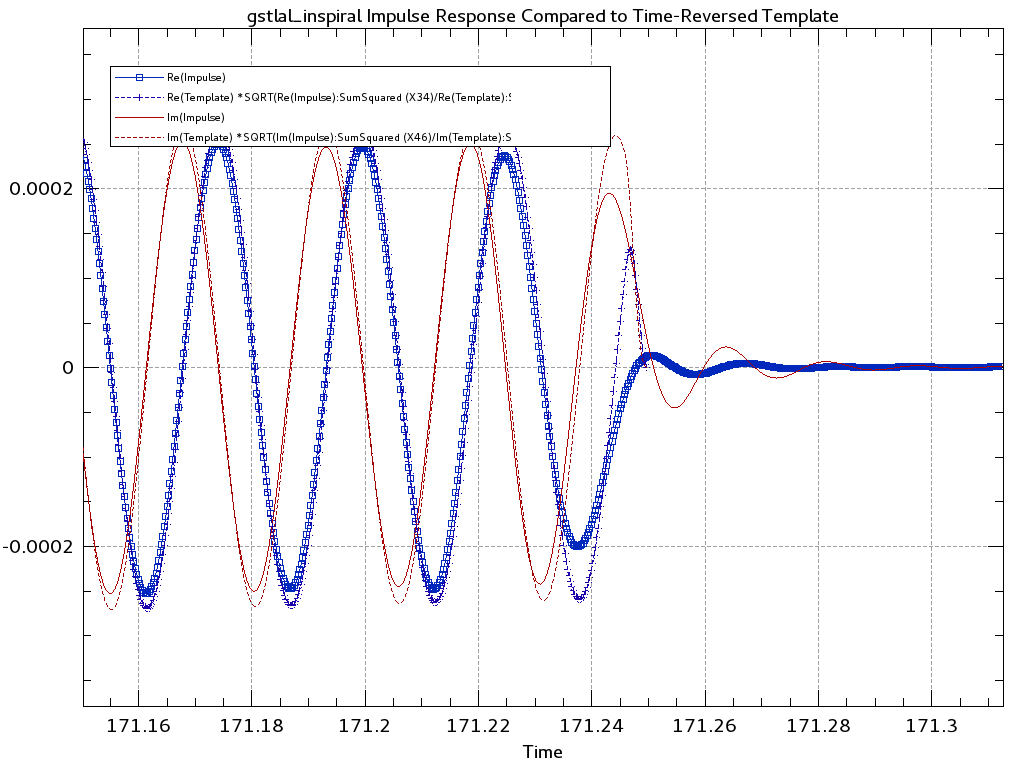
- delta function test: Inject delta-function and compare with time-reversed chirp
- Inject a chirp waveform into "slience" and compare with signal auto-correlation function
The following images show the delta function test:
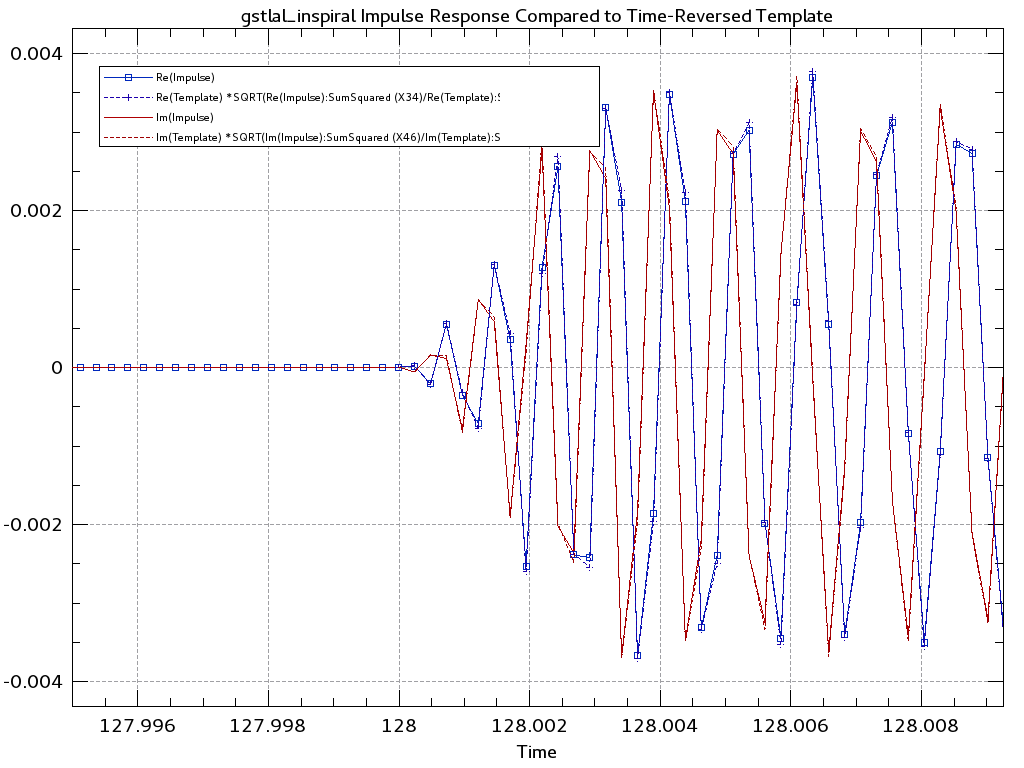
Response of gstlal using TaylorF2 to an impulse injected at t=128 s compared to time-reversed TaylorF2: Plot shows high frequency end of the waveform
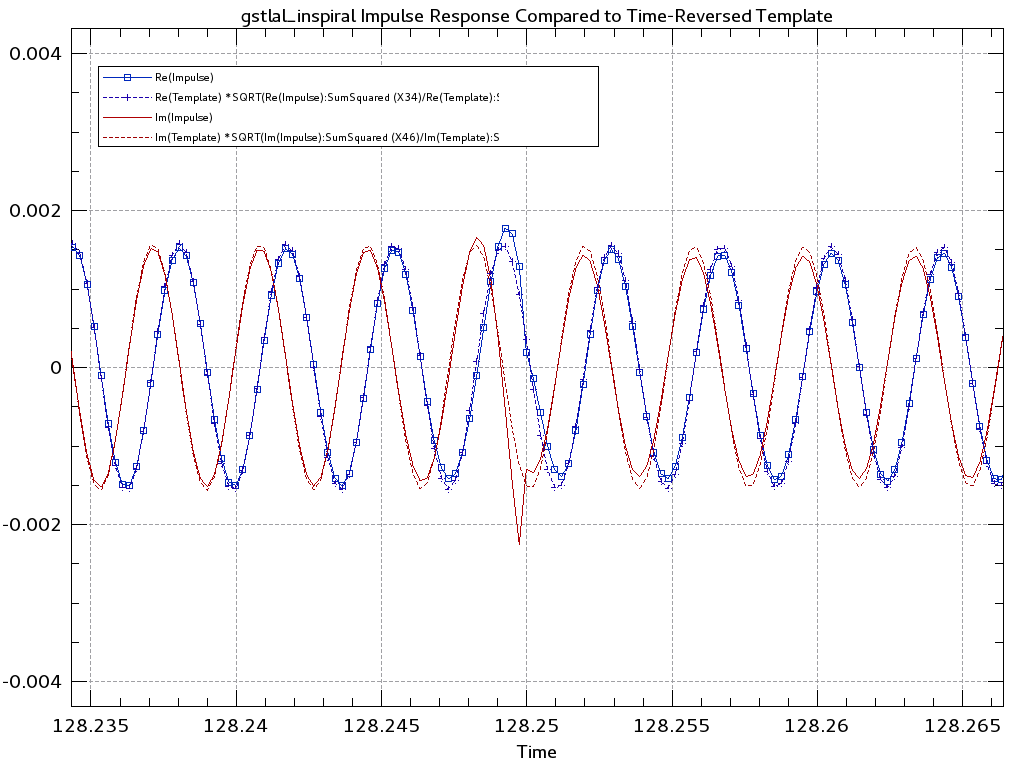
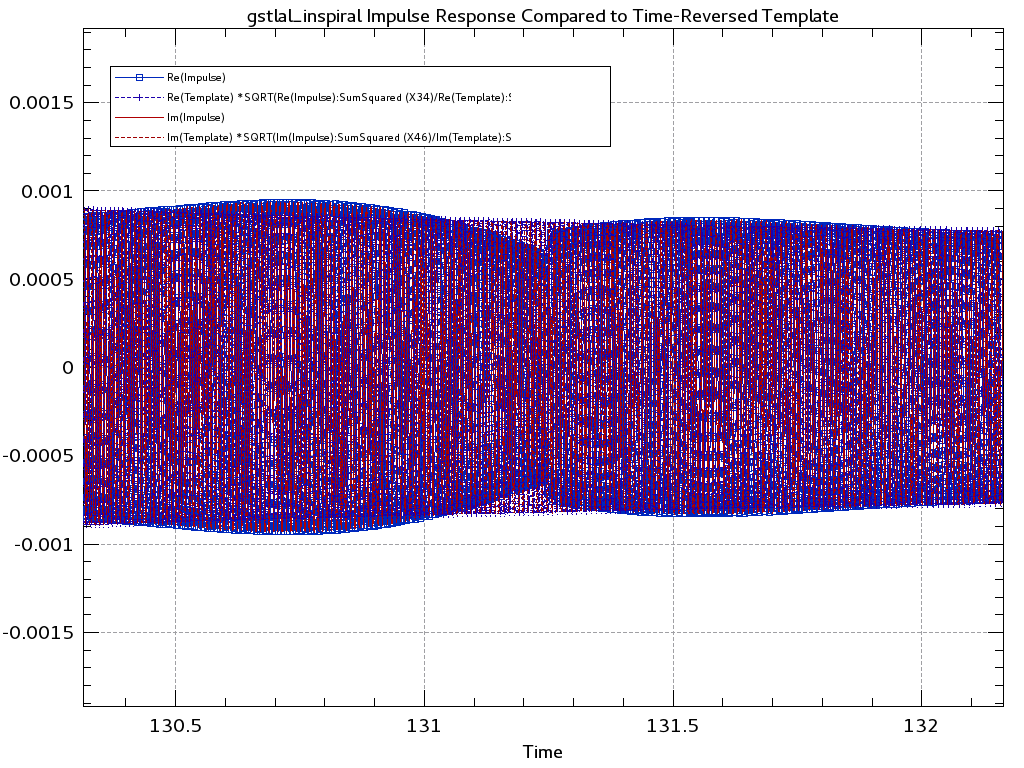
Same as above but 0.25 seconds later; the discontinuity occurs as a result of combining different time slices
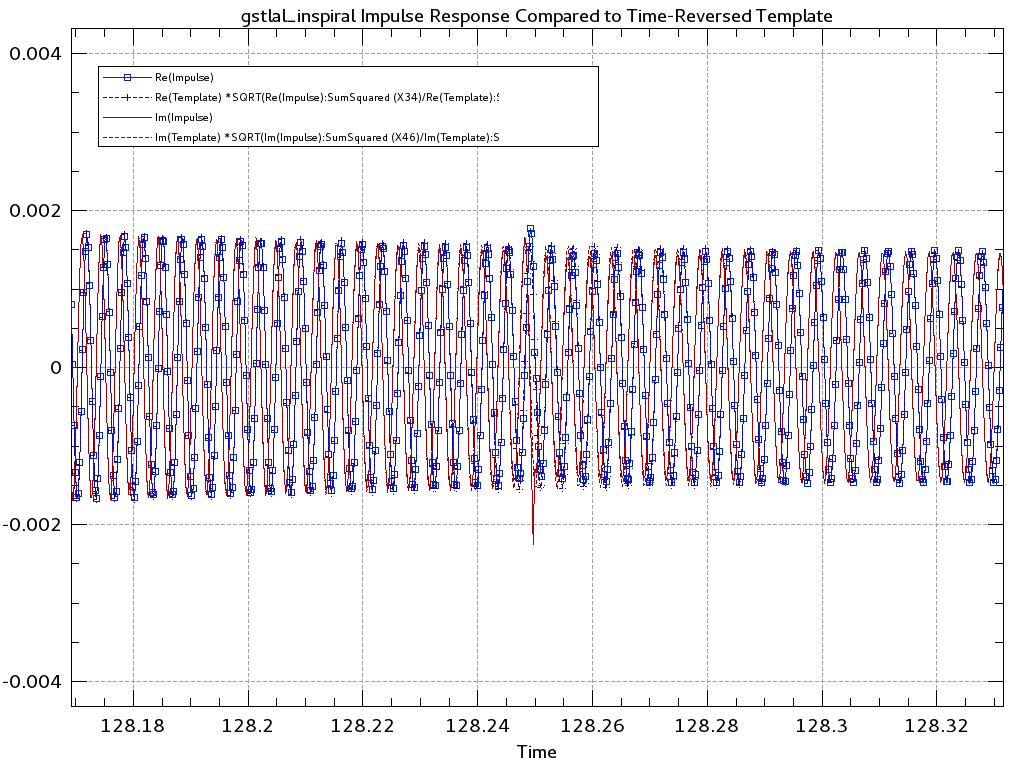
Zoomed out version of the same
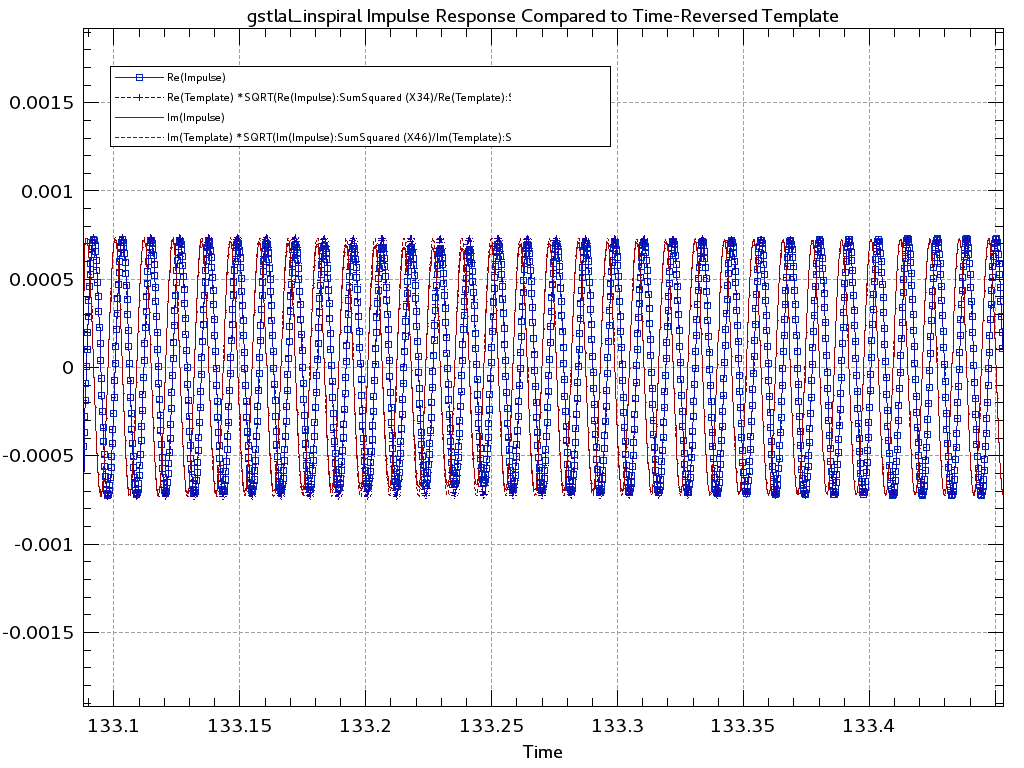
Same as above but a second later when another feature is seen: discontinuity could be due to a different sampling rate as well
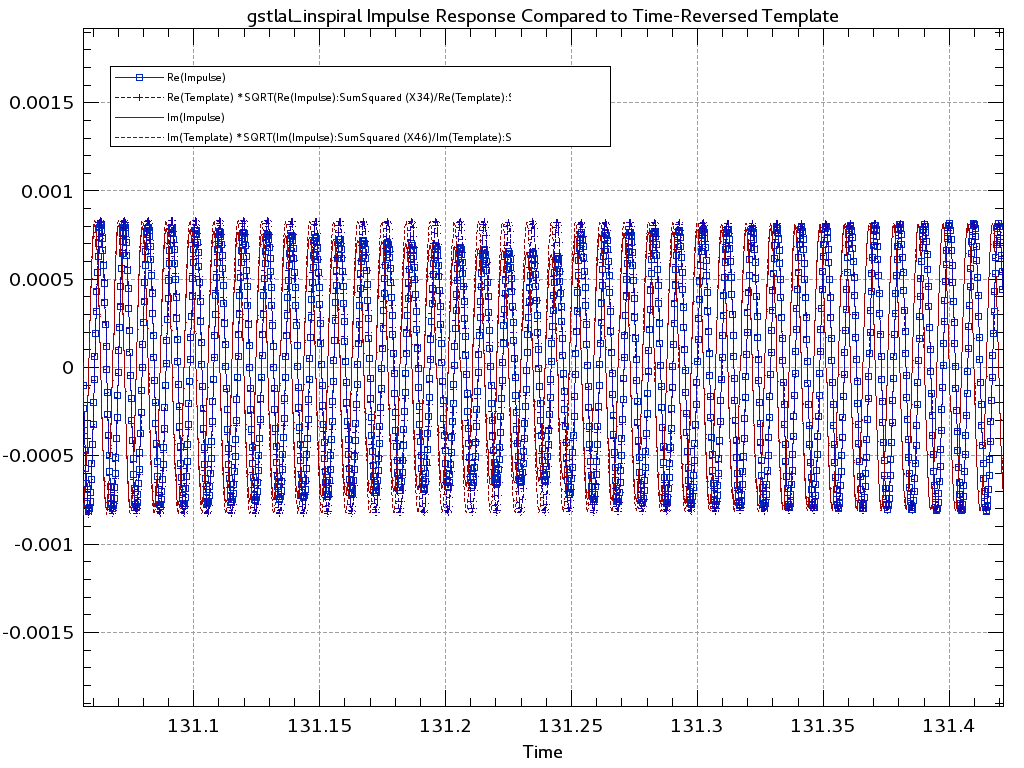
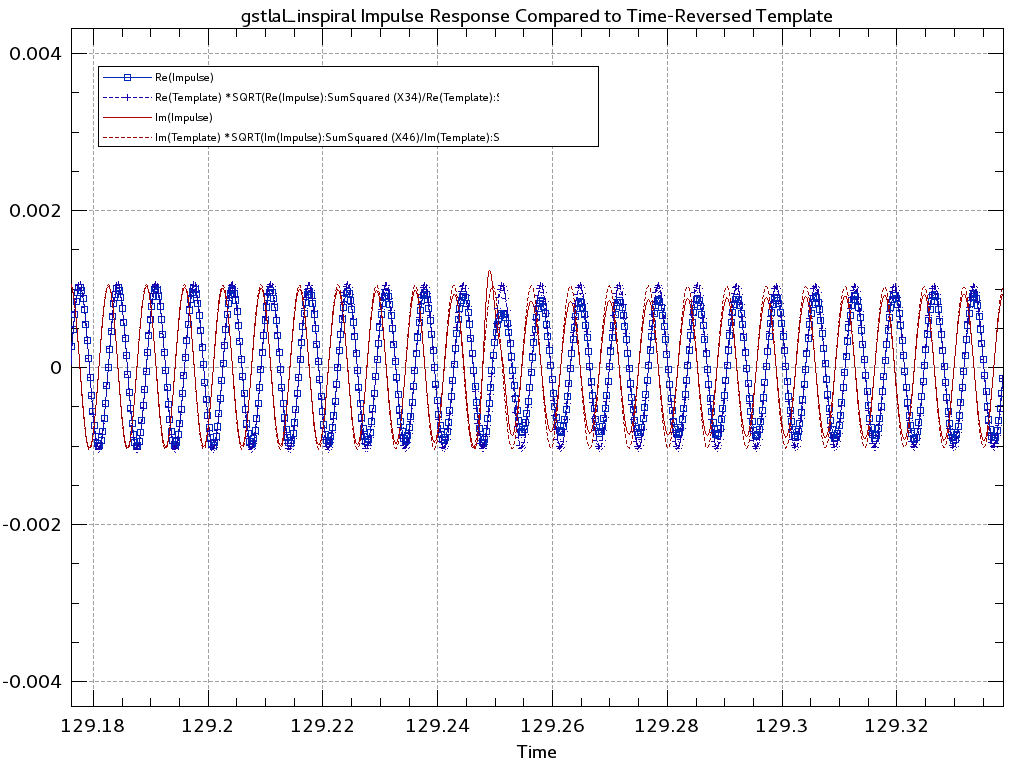
Figure shows how the response changes as one moves from one time-slice to the next
Zoomed out version of the previous figure to show transition from one time-slice to the next
Within a given time-slice there is very good agreement between svd bank response and the expected response
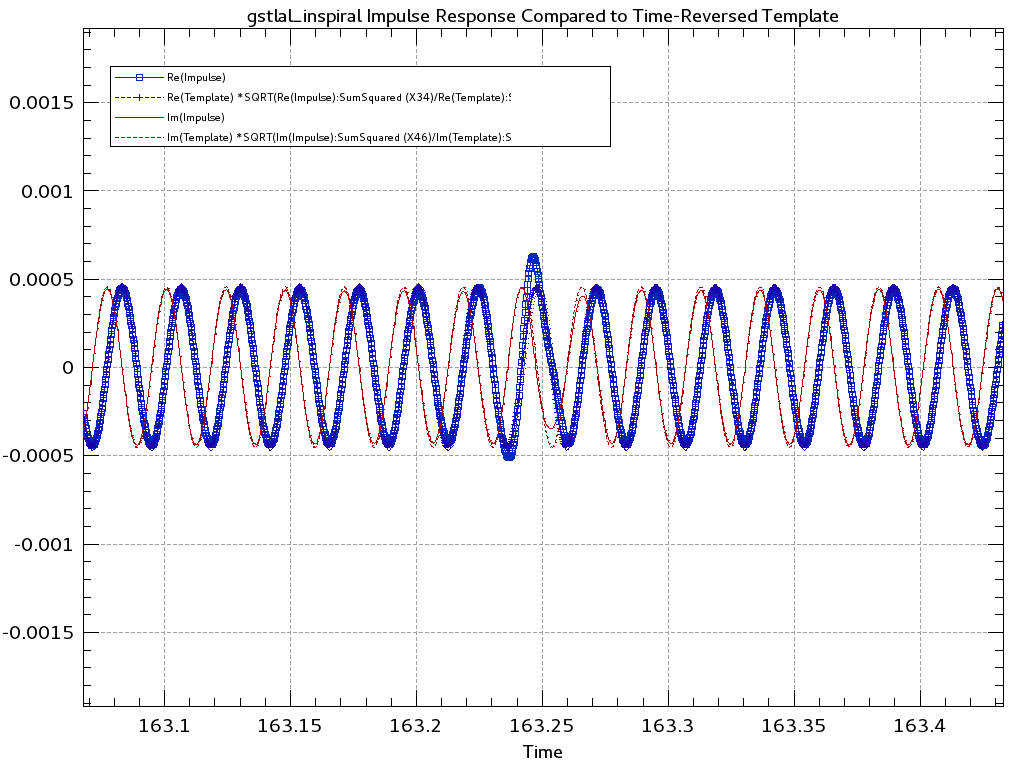
Another time-slice and a new SVD
Behaviour towards the end of the waveform
The image below shows the injection of a TaylorF2 into "silence":
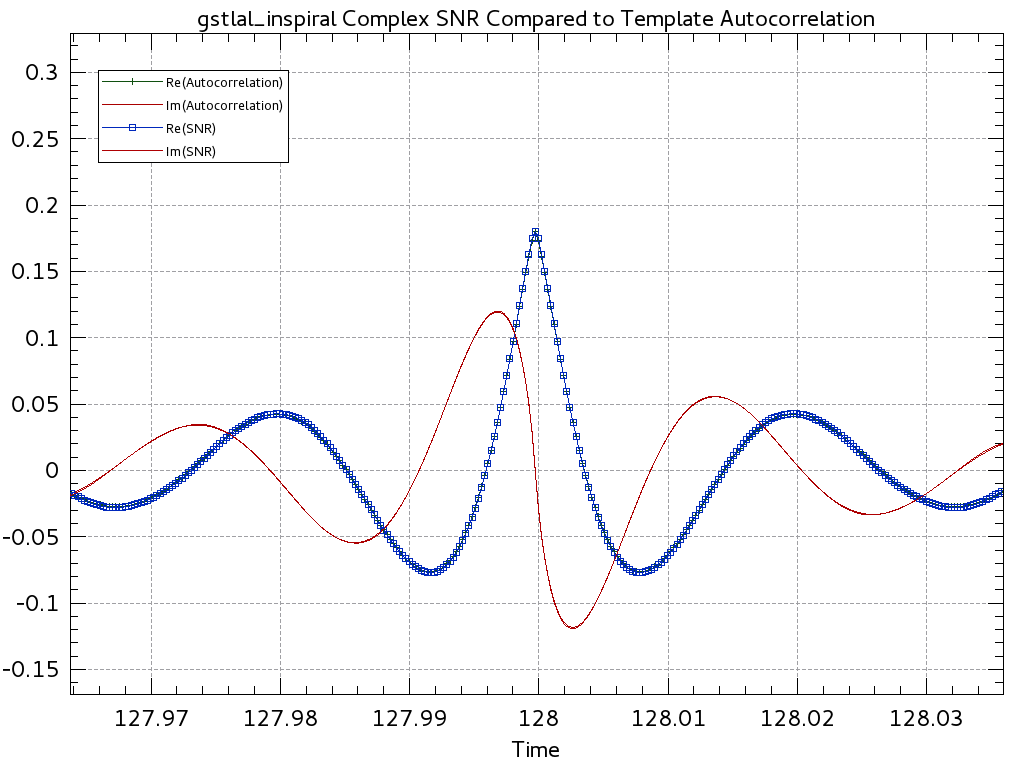
Comparison of SVD output with the auto-correlation function
Action Items
- Compute the actual expected SNR (instead of from average PSD) and plot the SNR histograms again
- We should compare the on-line and off-line results and understand the similarities and differences
- Figure out why multiple low-SNR events get the same likelihood (these constitute about a quarter of all events)
- Review of Summary pages at: https://ldas-jobs.cgca.uwm.edu/~gstlalcbc/MDC/BNS/Summer2014/recolored/nonspin/966384015-971384015-pipe-compare-CAT2/ALL_LLOID_COMBINED_openbox.html?ALL_LLOID_COMBINED_openbox_summary.html
- Make zoomed versions for accuracy plots
- Make Histogram of accuracies
- Make accuracy plots as a function of FAR
- Plot accuracy as a function of SNR
- Injections are found with
pi time-shift; probably coming from one time-slide (check and fix)
- What is the reason for close-by missed injections in missed-found plot (as a function of Mchirp)?
- Perpahs the prefactors_range (0.0, 0.10) might be too narrow
- Figure out the reason for the dip in the foreground plot (in SNR-Chisq section)
- Make efficiency plots (efficiency as a function of distance, effective distance and chirp distance)
- Compute the Range as a function of network for an IDEAL pipeline (T1200458, Figure 2 would be a good example)
- Update the online instructions including Makefile
- Review of GRACE-DB:
- Check live times.
- It would be useful to have a Table of CPU usage rather than for individual nodes.
- Currently, on-line analysis requests a headroom of 20% CPU. Can this be defended? Explore running some
nice jobs in the background and see if this affects performace
- The particular event we saw had a 17 minute latency for producing sky-map: https://gracedb.ligo.org/events/view/T124866
Minutes
- For online search one can look at dashboard.ligo.org to see if a given detector is producing data
- Live time etc. can be found at: https://ldas-jobs.cgca.uwm.edu/~gstlalcbc/online_analysis_node03.html
- The review committee should come up with a list of items that should go on the summary pages on GRACE-DB. (Consult with Detection Committee and the CBC group).
Jan 14
- Discussed program to compare FAR threshold with an equivalent SNR threshold efficiency program.
- gstlal_inspiral_BNS_MDC_study
- Efficiency curves... FAR of 1e-13 ~= min(rho_H1, rho_L1) > 7.25 for expected SNRs
- For recovered SNR, FAR of 1e-12 ~= min(rho_H1, rho_L1) > 7.25 * 0.95, i.e., because system is spinning, search only recovers 95% of expected SNR.
- GSTLAL is 1-sigma off of optimal coincidence performance in Gausian noise. For O2 this must be corrected.
- Discussed load balancing based on template lengths rather than mchirp bins.
- Flopulator might be a better scheme?
- Discussed conventions for tC estimation: there is error in the trigger generator conventions.
- Action: gstlal-inspiral/lib/gstlal_snglinspiral.c needs to get information about template peak time.
- Action: Les's patch needs to have a variable rather than fixed time-before-last-sample.'
- Impulse response test:
- Python program:
dt = 1.0 / 4096.0 for i in xrange(4096*256): if i == 4096*128: v = 1.0 else: v = 0.0 ` print '%.09fg' % (i*dt, v)
Convert to frame file withlalfr-fmt`- Change file name with
gst-launch filesrc location=foo.gwf blocksize=8395941 ! framecpp_channeldemux .C01 ! .H1:C01 framecpp_channelmux frames-per-file=256 ! filesink location=bar.gwf
- Run this through
gstlal_inspiral
Jan 15
- Action: What we want:
- Regular impulse response test with SVD
- Create an SVD bank with a flat PSD.
- Filter with a fixed flat PSD and zero data with a unit impulse.
- Compare with time-reversed chirp generated with
lalsim-inspiral.
- Impulse response test in pass-through mode
- Autocorrelation test: now have data correspond to a chirp in the bank.
- Continued investigation of comparison of template vs. impulse response of SVD filter.
- Seems to be an off-by-one-sample error; also funny discontinuities at the time slice boundaries.
- Not clear if the time slice boundaries are a bug or a feature.
- Overlap of template vs. impulse response is 98% w/o correcting the off-by-one sample.
- After correcting off-by-one-sample, overlap is 99.9013%.
- Tracking down off-by-one-sample error.
- Test: use a 3-sample fir matrix to analyze a frame with a delta-impulse
- Latency conventions appear the same between firbank and audiofirfilter for both "positive" and "negative" filters.
- However, firbank's fir_matrix and audiofirfilter's kernel seem to have different conventions (perhaps just reversed packing order?).
- Suspect that off-by-one-sample comes from a latency offset that is included in order for subbanks to overlap. Discussed alternatives for how this could be handled.
Jan 16
- Chad added various histograms in the Injection Accuracy section.
- Looked at some of the new histograms for the S6-recolored-spinning-BNS MDC.
- Stipes in eta accuracy appear to be due to an interaction between the layout of templates in the template bank plus the fact that spins tend to bias the pipeline to smaller eta.
- Appears to be a 10-sample bias in the recovered time.
- Action figure out what is going on here.
- Kipp fixed lloydparts.py (function) cbc_template_fir the off-by-one-sample bug by removing the extra sample of latency and instead changing the stride in the calcultion of the time slices.
- Run with SVD off but time slicing on.
- Now the reversed template and the impulse response agree.
- Errors occur at time slice boundary when those boundaries correspond to a change in sample rate. Indicates that the audioresampler causes features at the edges.
- Overlap is 99.994% in this case.
- Action Chad: there appears to be different behaviour when identity transform scrambles template order (perhaps doesn't clip first 10 templates').
- For SVD-decomposed templates, overlap is 99.8%
- Extra review tasks:
- How much data gets dropped at the beginning of a segment (filtering code)?
- Claim is it drops one filter length at the beginning.
- What happens at the boundaries of two contiguous segments in the offline pipeline?
Jan 17
- Suggestions for summary pages. I have borrowed some of the ideas from pyCBC summary pages an example of which can be found at: https://sugar-jobs.phy.syr.edu/~kent/cbc_review1/openbox/970012743-971622087/
- For missed found plots report the FAR used in making those plots (1/30 days is what was used for the summary pages linked at the top of this page)
- Better still, use a colorbar to show the FAR of found injections over a FAR range of 1e-12 (~ one per 10,000 years) to 1e-5 (~ one per day). It would be better to use different symbols for found found (filled colored circles) and missed (red crosses) injections.
- For injections that are expected to be found but missed one normally looks does a follow-up study. Not sure how automated this is. Can we get someone from DETCHAR to take on doing this for gstsvd?
- Under Injection Accuracy, plot accuracy (recovered-injected)/injected as a function of recovered SNR/likelihood
- We also looked at the summary pages of the new run with a larger
prefactor of 0.5.
- Larger
prefactor seems to have led to fewer found injections. This was unexpected but is it because the Table reports injections at a given FAR
- Action Item Likelihood plots in Sec 6.1 of summary pages should all be document. It might be best to include them in the new likelihood paper, especially SNR/chi plots, with the equations that were used to produce.
- Test: Filter a waveform exactly matching a template in the template bank in zero noise and fixed, uniform PSD.
- Expect to recover autocorrelation function.
- Result is the expected autocorrelation function, but with a one-sample offset.
- Not clear if this is a problem with the waveform filtered being off-by-one-sample or if there is a residual off-by-one-sample in the code.
- Proposal is to redo test with time-domain waveforms, e.g., TaylorT2, used for both the bank and the data. Add one template to the bank with the waveform mass parameters and use
lalsim-inspiral to generate that exact waveform for injection. This should give an unambiguous determination if there is an off-by-one-sample error in the filtering code.
Jan 18

 1.8.1.2

